And out of the ground made the Lord God to grow every tree that is pleasant to the sight, and good for food; the tree of life also in the midst of the garden, and the tree of knowledge of good and evil. Genesis 2:9
The Bible placed Adam and Eve in an Eden they were soon to lose. Today the approach of a new millennium finds Homo sapiens at a historical transition between a world inherited and one profoundly different–a global biosphere whose vital functions we have altered.
While burgeoning human numbers place unprecendented demands on farmland, forests, and other resources, the expanding technological civilization that made those numbers place produces changes in the continents' green skins of vegetation and in the interactions between atmosphere, land, oceans, and living organisms that sustain virtually all life on Earth.
Massive changes have affected planetary life since the earliest life-forms stirred. Continents have moved, oceans and maountain ranges have been made and unmade, ages of heat and cold have waxed and waned, and even the atmosphere has changed–as a result o life itself–from one nearly devoid of oxygen to one rich in the life-fueling element. Mass extinctions of species have accompanied some eras of radical change, but always life has survived and evolved.
Human dominance of the globe has ushered in a new period of extinctions, primarily by usurping natural habitats. Pollutants in the environment can wreak unforeseen results, among them a global warming trend that could push average temperatures highter than any in the experience of the human race. A “nuclear winter” caused by global war might mean the end of most life-forms.
Yet along with potential self-destruction, the present moment of technology's course has delivered tools of knowledge never before in hand, among them earth=sensing satellites that daily report global conditions and computers that log and assemble millions of simultaneous observations. Now ablefor the first time to watch the global mechanism of life at work, we must hope to comprehend and gain control of our unwitting experiment with the future of the Earth.
Pastures of the Sea
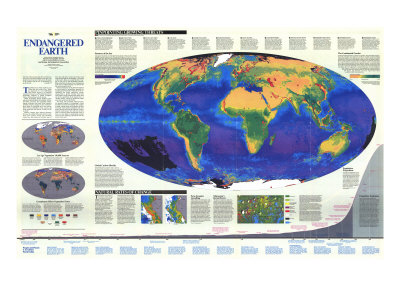
Life's green foundation, the chlorophyll-bearing plants of land and water harness sunlight to produce organic matter through photosynthesis. At the first tier of the aquatic food web, microscopic free=floating plants called phytoplankton tinge the waters where they thrive, so that surface hues reveal the oceanic regions' relative fecundity. ... ocean-color readings made by NASA's Nimbus 7 satellite were averaged over 18 months. Color-code reds and oranges indicate areas of highest productivity, such as the nutrient-rich polar seas, temperature and tropical continental shelves, and wind-driven upwellings on the western coasts of the Americas and Africa. Yellows and greens show moderately productive regions in Pacific and Atlantic equatorial currents, along contesting currents in the North Pacific, and where winter turbulence stirs up nutrients for spring blooms in the North Atlantic and North Pacific. Light blues ... show less productivity. Least fertile are mid-ocean gyres. Black areas near the Poles are sea ice. ...
The Continental Garden
Of all terrestrial living matter, 95 percent is vegetation. The chlorophyll content indicates the potential for new production. The NOAA 7 satellite recorded worldwide land-surface radiation in the visible and near-infrared bands to estimate chlorophyll and leaf mass. Three years of daily global readings went into an image to map regional average potential for photosynthesis throughout the continents' green mantles. Combined with the presentation of ocean plant life, it gives us a first-of-a-kind view of the productive potential of Earth's vegetative biomass. ... the highest potential production in darkest green, primarily in rain forests ... next come other tropical and subtropical forests, temperate forests and farmlands, and, surprisingly, some drier regions such as savannas and pampas. Season croplands in North America's Midwest and the Soviet (Russian) steppes show lower potential for new growth, while boreal forests and the dry Australian outback rank lower still. Deserts, high mountains, and Arctic regions reflect barren conditions. Inland waters appear red.
PINPOINTING GROWING THREATS
1. POPULATION PRESSURE
Kenya's 4.1 percent growth rate–the world's highest–will double its 23 million people by 2005. At 2 percent, India would reach 1.6 billion by 2075, rivaling China, with a 1.4 percent rate, as the most populous country. Third World urban areas, such as Manila and Sao Paulo, swell from rural migration. Developed countries such as West Germany have seen lowered birth-rates and even population decline.
2. AIR POLLUTION
Mexico City ranks among the worst of urban environments. Cleanup in Tokyo has reduced smog. Once plagued London and Pittsburgh purged their air. Industries have blighted vegetation near Sudbury, Ontario, and in the Soviet's Kola Peninsula. Motor-vehicle exhaust and power plant emissions dirty the once pristine American West. Cubatao, Brazil is one of the world's most polluted communities.
3. OZONE CONCERNS
Man-made chlorofluorocarbons contribute to a deepening hole in upper-atmosphere ozone–a filter of the sun's life-damaging ultraviolet radiation–observed seasonally over Antarctica. Depletion also have been noted over the Arctic and heavily populated mid-latitudes. In contrast, industries and motor vehicles contribute ozone to low-level pollution, but it does not rise to upper levels.
4. ACID RAIN
First recognized as a regional issue in Scandinavia, acid rain, snow, and fog kill fish and other aquatic biota and damage forests in Canada, the U.S., and western and central Europe. An estimated 200,000 square miles of forests in industrial countries are damaged by acid rain or other forms of air pollution. A problem that wafts across borders, it demands international solutions.
5. WATER POLLUTION
Fertilizers and urban runoff increase sedimentation and skew conditions in estuaries and coastal waters, affecting fisheries. Some rivers, like the Thames, have been cleaned up, with native species reappearing. The Caspian, Baltic, and Mediterranean Seas suffer from large coastal population and industry. Posts like Jakarta, Bangkok, and Manila brew noxious stews. Improvements have been made in Lake Erie.
6. WATER DIVERSION
Tapped for agribusiness, the nighty Colorado River reaches the sea as a trickle. Stream diversion in China emptied a lake, Lop Nur. A Soviet river-diversion scheme that threatened the regional ecological balance was abandoned. The Nile's Aswan High Dam has depleted farmland of silt nd the eastern Mediterranean of nutrients. Overused aquifers are dropping in Africa, Asia, and North America.
7. TOXIC WASTES
New Jersey's Meadowlands bear the poisons of megalopolis. At New York's Love Canal, a sickened community was evacuated from atop a toxic waste dump. Part of San Diego Bay holds extremely high concentrations of PCBs. Irrigation has concentrated heavy metals in the Beijing-Tianjin basin and selenium at a California wildlife refuge. Cleaner rechnology ended mercury poisoning at Minamata, Japan.
8. RADIATION PERILS
Disaster at the Soviet Union's Chernobyl Nuclear Power Plant in 1986 caused the single greatest industrial release of radiation, dwarfing an accident at Three Mile Island in Pennsylvania. Waste disposal also poses unanswered problems. Several nations test nuclear weapons. Bikini Islanders cannot yet return to a home contaminated by U.S. testing. Japanese atom-bomb survivors suffer radiation effects.
9. SPECIES EXTINCTION
Deforestation as in Brail, Madagascar, and Southeast Asia is the prime cause for the loss of thousands of species a year. Refuges in Africa, North America, and Asia face isolation as biological [islands.” Introduced Nile perch devastate Lake Victoria's more than 300 species. Black rhinos are nearly extinct, Florida manatees endangered; but sea otters, gray whales, and whooping cranes have come back.
10. FISHERIES DEPLETION
In the past 40 years, overfishing and natural causes have combined to produce alarming declines in certain stocks of anchovies, sardines, and cod, some followed by resurgences. Pollution also takes a toll. Shellfish dwindle on U.S. coasts. Fishermen off the Philippines bomb and poison reefs. Antarctic krill harvests may undermine the food web. U.S. laws have lowered dolphine tolls in Pacific tuna harvests.
11. DEFORESTATION
Life's greatest storehouse, tropical forests shrink annually by an estimated 80,000 of their total ten million square miles through expanding agriculture, logging, and development. Demand for fuel has denuded African woodland and slopes in Haiti and Nepal–where erosion, landslides, and floods have increased and no cover may remain by 2020. Costa Rican parks preserve tropical ecosystems.
12. DESERTIFICATION
Prolonged drought in the Sahel has coincided with population growth, orvergrazing, and the closing of political boundaries to disrupt patterns of nomadic life. Resulting pressure on marginal land has sped the spread of desert conditions. Saliniation strangles irrigated fields in Australia. Israel has experienced notable success at revegetating deserts, and China has instituted mass plantings for reclamation.
Ice Age Vegetation 18,000 Years before present (BP)
The Earth of our ancestors wore continental ice a mile thick as far south as the Great Lakes when the most recent glacial epoch peaked 18,000 years ago. Lower sea-surface temperatures and an atmosphere averaging four to six degrees Celsius colder than ours today shaped a global climate both more and less hospitable. A vegetation model applied to an Ice Age climate model indicates patterns of vegetation in which some desert areas are wetter than at present, tropical rain forests are smaller and in different locations, and temperate and subtropical forests and woodlands are more widespread. Tundra and high-latitude forest occur much farther south in the Northern Hemisphere and claim the southern end of South America. ...
Greenhouse-Effect Vegetation Zones
Tomorrow's weather will be hotter. Some regions will be drier, others can expect greater precipitation. This global forecast is based on the increased release of certain gases through human activity: methane, nitrous oxide–and CO2, which contributes more to the growing greenhouse effect than the other two combined. At present rates of growth the effect of such gases could double by the mid-21st century, perhaps producing a climate warmer by some four degrees Celsius, leading ultimately to drastic changes in vegetation. The tropics and some deserts receive greater rainfall. Terperate climes become warmer and drier; polar regions experience that greatest warming. Vegetation will adjust, flourishing where favored by temperature and moisture, struggling where conditions deteriorate.
Global Carbon Dioxide
Chief building block of organicmatter, carbon is also present in the atmosphere, oceans, soils, and rocks. Through physical, chemical, and biologic processes, carbon is transferred between these reservoirs, primarily as carbon dioxide (CO2) is the prime mover in an anticipated rise in global temeratures that many scientists believe has already begun (the greenhouse effect). A substantial portion of recently released CO2 is not accounted for by current estimates of transfer rates. This portion is probably taken up by ocean water and marine organisms, and perhaps by increased rates of organic growth on land. Satellite-generated estimates of planktonic biomass and terrestrial photosynthetic potential could help in understanding life's role in the long-term climate trends.
NATURAL RATES OF CHANGE
The biosphere has complex interactions by which a change in one element of a natural equation–such as greenhouse warming in the biosphere–initiates changes in other elements–ocean volume, ice , cloud, and vegetative cover, plus Earth's reflectivity. The workings of global mechanisms are not well-enough known to predit the outcome of human-induced changes.
For 3.5 billion years life and its host planet have conspired in shaping the other's evolution. For eons microscopic creatures have transformed the chemisty of oceans, atmosphere, and soils. Vegetation helps determine erosion rates, while physicalforces, in turn, help shape the patterns of growth.
Previous climatic shifts have occurred over lengths of time that allowed flora nd fauna to adjust as overall patterns moved. Judged against naturl change, man-made global effects bring results at lightning speed–with consequences felt in just two industrialized centuries. This rapid change and such new elements as ozone-destroying chemicals not naturally present hamper our ability to predict the extent or duration of long-term effects.
The biosphere's pulse flutters in cycles ranging from seconds to tens of millennia. Plankton may bloom for a day and never be seen by a research vessel; trees grow and fall while a forest lives on as an entity. Thus the new space-based ability to measure global change looms large in the trial of nature's latest biological innovation–humankind, with its capacity to understand and influence the biosphere.
Peru-Ecuador Upwelling
Where offshore winds bring deep, cold, nutrient-rich water to the surface, fields of phytoplankton bloom off Peru ... Digital images taken three weeks apart illustrate how the shifting patterns of wind, water, and marine life–along a coast comparable in length to that between Long Island and South Carolina–rapidly change the ocean. Unmeasurable by traditional shipboard sampling, which would take decades to provide a comparable amount of data, the event was recorded by satellite in just minutes.
Minnesota's Boreal Forest
“We think of vegetation is static. It's vibrant in a way we don't understand,”says Dr. Forrest Hall of the National Aeronautics and Space Administration. A NASA landsat satellite monitored boreal forest in northern Minnesota to delineate internal change over a ten-year period. A color-coded mosaic charts changed and unchanged areas of vegetation. Surprisingly, natural processes–normal vegetative succession as well as fires, old age, insects, and wind–altered 50 percent of the protected Boundary Waters Canoe Area in ten years. Still, rates of change from nature forest to deforested and regenerating areas were five to ten times lower there than on logged land outside it borders.
Population Projections
As infant and childhood survival rates improved with public health, growing numbers reach childbearing age; life expectancies also increase. The doubling period for world population has shortened from centureis to mere decades. Three ranges project the size of future population; graph on map each projection assumes that birthrates in the next half century will fall enough to lead to zero growth.
Population Explosion
The five billion human beings alive today represent probably 6 to 7 percent of all who have lived in our species' 350,000- to 100,000-year genealogy. From perhaps four million at the peak of the last Ice Age, growth accelerated slowly until the industrial revolution 18,000 years later. After a global population surge, birth-rates declined in developed countries, and today their populations are near, and even below zero growth. After World War II quantum improvements in public health were swiftly exported to less developed countries, dramatically lowering death rates. Declines in birthrates often lagged behind, causing unprecedented population growth. A majority of mankind still lives in an agrarian, preindustrial condition, with birthrates approaching Kenya's eight children per woman. Today's soaring number occur almost wholly in nations least able to afford them, where masses live on the edge of survival, often on marginal or unsuitable land.
TIMELINE -
16,000 BC - World population 4 million - Humans emerge from Ice Age as skilled equipped hunter-gathers. Neolitiic (New Stone Age) revolution from food gathering to producing.
People and Planet: A Troubled Partnership
EARLY HUMANS
Once forested regions of Arica, Asia, and Europe felt the hand of humans far back in prehistory, when huner-gatherers learned to set fires to drive game and clear brush–still practiced by semi-nomadic tribes in Africa.
ORIGINS OF AGRICULTURE
EARLY CIVILIZATIONS
GROWTH OF CITIES
PUBLIC HEALTH
AGE OF COLONIALIZATION
AGE OF RESOURCE USE
THE OIL REVOLUTION
THE CHEMICAL ERA
PARKS AND REFUGES
ENVIRONMENTAL LAWS AND TREATIES
The 1899 Rivers and Harbors Act first legislated U.S. control of water pollutants. The 1916 Migratory Bird Treaty between the U.S. and Canada initiated internation conservation. The 1970s saw new environmental laws.
FEAST AND FAMINE
World food production could feed more than present numbers, but economic inequities, politics, and indifference keep about 10 percent of humanity critically malnourished. Famine induced by political upheaval and war is still a reality.
CLIMATIC WARMING
How fast, how far, and how long climate will warm are unknowns as average temperatures surpass historical ranges: The hottest years in this century occurred in the 1980s, the hottest decade on record. Agriculture could shift as sea levels rise.
EARTH FROM SPACE
First photographed in its entirety from a Lunar Orbiter in 1966, Earth is a prime target of space research. In the 1990s the U.S. plans a new generation of earth-sensing satellites and a space station for sustained human observation.
|