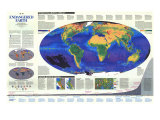
CONTINENTAL MARGINS: Submerged land between shore and ocean basin, including the continental shelf, slope, and rise. Most ocean plants and animals live in the shelf's shallow, sunlit waters.
TRENCHES: Formed when dense oceanic crust slides beneath lighter oceanic or continental crust. The Mariana Trench, Earth's deepest, plunges nearly 11 kilometers benearth the Pacific's surface.
SEAMOUNTS: Active or dead underwater volcanoes rising at least a thousand meters above the seafloor. Those that penetrate the surface become islands, such as the Hawaiian chain.
ABYSSAL PLAINS: Develop in areas of high sedimentation, such as just off continental margins. These extensive, featureless regions of the ocean floor constitute Earth's flattest surfaces.
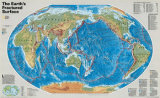
RIDGES: Underwater mountain ranges cleaved at right angles by fracture zones. The Mid-Ocean Ridge, Earth's longest mountain chain, winds 74,000 kilometers (nearly 46,000 miles) around the globe.
THE OCEAN CRUST constantly on the move reminds scientist of a slow-motion conveyor belt. ... Magma rises up at a ridge as the seafloor moves toward the continental margin at an average rate of six centimeters a year. The heavier seafloor dives under the landmass and utimately melts. Magma from an isolated hot spot sorms seamounts and islands.
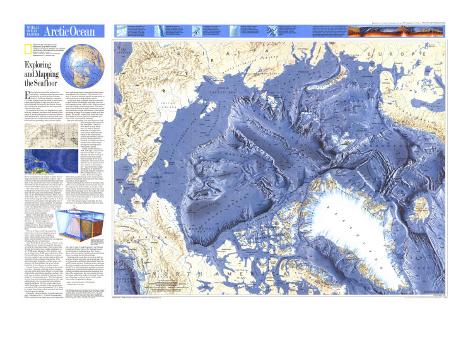
Early mariners assume the oceans to be bottomless – immense and mysterious realms inhabited by powerful gods and fantastic creatures. Ferdinand Magellan, pausing in 1521 in his voyage around the world, is said to have tossed spliced lengths of rope over the side and waited patiently for the end to hip bottom. Seeing that it did not, he proclaimed that the oceans were “immeasurably deep.”
Magellan was right in his day. Accuracy has always been limited by technology. confineing themselves to coasts and harbors, early mariners were primarily concerned with ensuring that there was enough water beneath the ship's keel to prevent grounding. When the first regular charts were produced, they failed to depict the true shape and features of the seafloor. Indeed, it has only been with the past generation that large-scale maps of the ocean floors have been developed, and only in the past few decades that we have been able to measure these hidden landscapes with precision.
The whole matter of ocean-bottom mapping took an abrupt turn in the 19th century when plans were made for the laying of the transatlantic telegraph cable. In the 1840s Matthew Fontaine Maury, head of the Navy's Depot of Charts and Instruments (now the Naval Oceanographic Office and the U.S. Naval Observatory), persuaded vessels plying the seas to send him reports on ocean conditions. In exchange he would send them his famous Wind and Current Charts, developed after systematic study of ship's logs kept in the depot's storerooms. At the same time, he instructed navy vessels to record oceans depth soundings.
Maury's 1855 map was an early bathymetiric contour chart of the North Atlantic. the method that produced the chart–the leaded weight and sounding line–was both laborious and fraught with error. Yet it remained the best technology available until World War I.
The loss of Titanic in 1912 prompted the introduction of echo-soounding instruments. Later, sound navigation and ranging, or sonar, which bounces sonic waves off an object, was developed for underwater investigation, including detection of submarines.
After World War I, Harvey Hayes of the U.S. Naval Experimental station in Annapolis, Maryland, invented the sonic depth finder. Before that breakthrough there existed only a single sounding for every 14,000 square kilometers of the Atlantic, and one for about every 26,000 square kilometers of the Pacific and Indian Oceans. Suddenly our information base exploded, and our impression of a flat and featureless seafloor change dramtically. With newly discovered mountains, volcanic cones, vast canyons, and abyssal plains, the ocean bottom turned out to be as diverse as the land surface.
A major feature of Hayes's invention was its ability to have a ship take soundings without stopping. Any ship with a depth finder affixed to its hull could crisscross the ocean taking soundings, making it relatively easy to produce a profile of the undersea terrain simply by “connecting the dots.” The first bathymetric chart from such sounding appeared in 1923, and additional data were incorporated and published regularly afterward. The first contour map of the Arctic Ocean floor was made in 1958, when the submarine U.S.S Nautilus cruised beneath the surface ice pack of the North Pole taking sonic readings.
During the 1960s two further breakthroughts took place. Scientists at the U.S. Naval Oceanographic Office transformed the single-beam echo technology into a multibeam system, generically dubbed swath or multibeam echo sounders. This allowed for an array of beams to measure depth in the swath nearly as wide as the water is deep.
At the same time the British Institute of Oceanographic Sciences developed a long-range side-scan sonar imaging system, called GLORIA, that uses sound to produce images of geologic features. The instrument is towed behind a survey ship and records the strength and character of the echos, producing an image of an expanse as wide as 60 kilometers. The results, coupled with depth data from the multibeam surveys, provided completely new views of the ocean-bottomm landscape.
But more was coming. The next step ws to measure the shape of the ocean surface from space. Gravity attracts water in areas where there are massive features. Mountains and ridges draw water toward them and cause bumps in the ocean surface; canyons and trenches cause depressions. Radar altimeters mounted on satellites are able to measure these subtle bumps and dips by bouncing microwaves off the surface.
NASA launched Seasat in 1978. although it operated for only three month,its radar altimeter was able to survey 95 percent of the ocean surface with a precision of five to ten centimeters. The new Geosat altimeter was an improvedsensitivity of three to sixcentimenters–a precision that brought the discovery of hundreds of prviously unknown seamounts. When William Haxby of the Lamont-Doherty Geological Observatory produced maps of the marine gravity field from the satellite data, many new rifts, ridges and fracture zones appeared.
Marine technology has evolved to the point today where we can send people and instruments down to the deepest parts of the world's oceans, to do this safely requires detailed information about the ocean bottom and the geologic forces that shape the ocean basins. Deep-diving submarines and submersibles need to know how to find their positions in an underwater world of perpetual darkness, so precise charts for bottom refernence are vital.
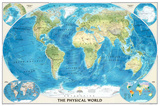
Even with advanced space technology the only way to get an accurate bathymetric chart is to send a survey ship. A map prepared by the National Geophysical Data Center of the National Oceanic and Atmospheric Administration shows relief beneath the Caribbean Sea and Atlantic Ocean, including the Mid-Ocean Ridge.
Mapping of the ocean floor is now done with an accuracy thought impossible just a decade ago. We are witnessing an explosion of knowledge about the world's oceans and seas. Each new survey, each new dive of increasingly sophisticated deep submersibles and ROVs reveals in formation pertinient to matters ranging from continental drift and plate tectonics to commerical fishing and submarine navigation. For lack of the proper tools, this vast undersea frontier has defied exploration until very recently. Now that new technology is at hand, slowly, Earth's underwater realm is beginning to emerge.
FYI - Sir John Franklin mapped almost two thirds of the northern coastline of North America.